What Works Clearinghouse (education)
What Works Clearinghouse (education)
Large database of education effect sizes created by Institute of Education Sciences (Institute of Education Sciences 2025).
Snapshot date: 17 May 2025
Data availability: flat files are available at https://ies.ed.gov/ncee/wwc/studyfindings. Per permissions and disclaimers section on that website: “Unless stated otherwise, all information on the U.S. Department of Education’s IES website … is in the public domain and may be reproduced, published, linked to, or otherwise used without permission from IES.”
Data collection: The WWC source data have 13,054 findings (data rows) across 1,908 reviews. The dataset includes effect sizes, but not standard errors, as well as p-values reported by the studies and p-values re-calculated by the WWC reviewers. After BEAR processing and filtering, 12,045 findings are retained.
Data processing: We retained only RCTs and quasi-experimental studies (98% of data altogether). Where available, we preferred effect sizes and p-values calculated by WWC to the ones reported by the studies. We replaced p-values that were equal to zero (this occurred in 3% of the dataset) with truncated p-value (i.e. assumed \(p < 10^{-16}\)). We calculated z-values from these p-values under assumption of two-sided tests. We then applied the sign of the reported effect size, so z-values are signed where the effect size is non-zero.
Additional grouping variable: “outcome domain” variable (e.g. “academic achievement”, “alphabetics”)
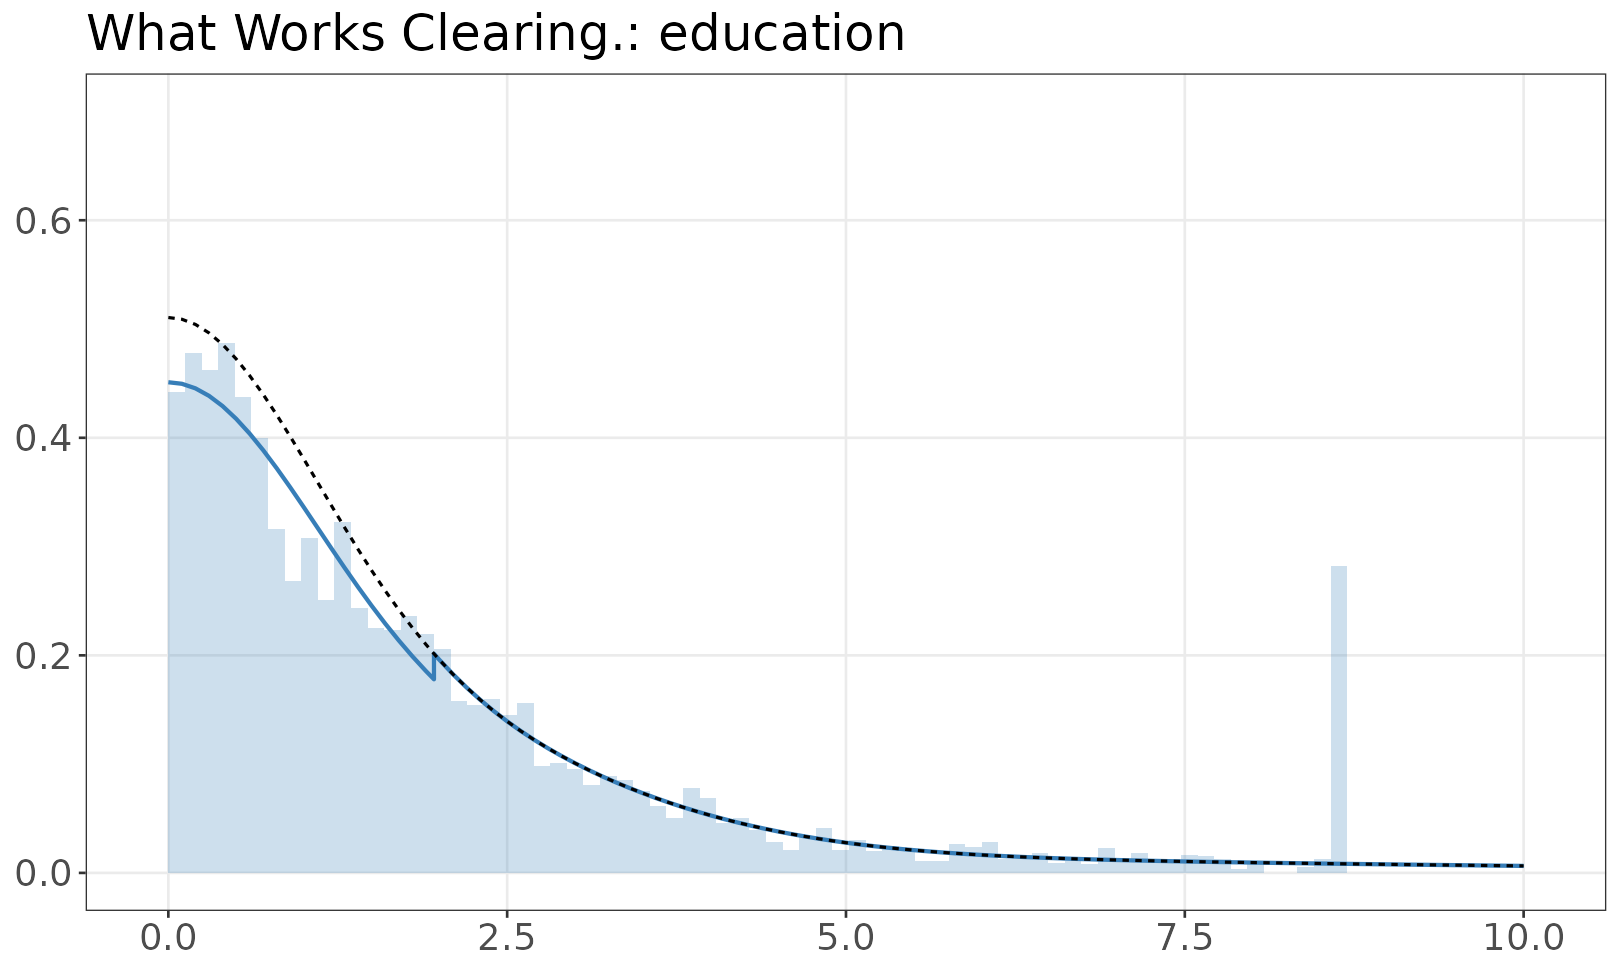
Model of z-values
The fitted mixture model is shown over the empirical distribution of absolute z-values. The solid line is a mixture of half-normals, with selection. The dashed line shows the distribution without selection. If there are inequalities (e.g. studies reporting p < 0.05) the histogram resamples values from the appropriate set.