clinicaltrials.gov snapshot
To download only this data file: clinicaltrialsgov.rds (3.1 MB)
To download all BEAR datasets, click here.
clinicaltrials.gov snapshot
Trials which reported results at clinicaltrials.gov (National Library of Medicine 2025)
Snapshot date: 12 August 2025
Data source: This is a set of flat file of studies obtained via https://aact.ctti-clinicaltrials.org/ (over 2GBs of data for relevant tables), with relevant columns extracted and joined by us before BEAR processing.
Data availability: terms and conditions for ClinicalTrials.gov are at https://clinicaltrials.gov/about-site/terms-conditions. We make distributions of derived effect sizes available in accordance with ToC’s. We only use publicly available data and do not imply any endorsement of this work by National Library of Medicine, ClinicalTrials.gov or AACT.
Data processing: extensive. We kept only studies where status was “Completed” and only rows of data where outcome type was “Primary”. We set year to the year of completion_date.
See Standard procedure for dealing with p-values and confidence intervals for how we created and chose the z-values based on p-values and confidence intervals. Briefly, we calculated z-values using two separate procedures (based on p-values and confidence intervals) and, if both were available, we made a judgement on which one was more appropriate using a pre-defined rule. ClinicalTrials.gov reports the number of sides for confidence intervals but not for p-values, so we treated p-values as two-sided. We dropped rows only when z was missing. Notably, infinite z-values can arise when p_value is recorded as exactly 0, and these are retained because they are not missing.
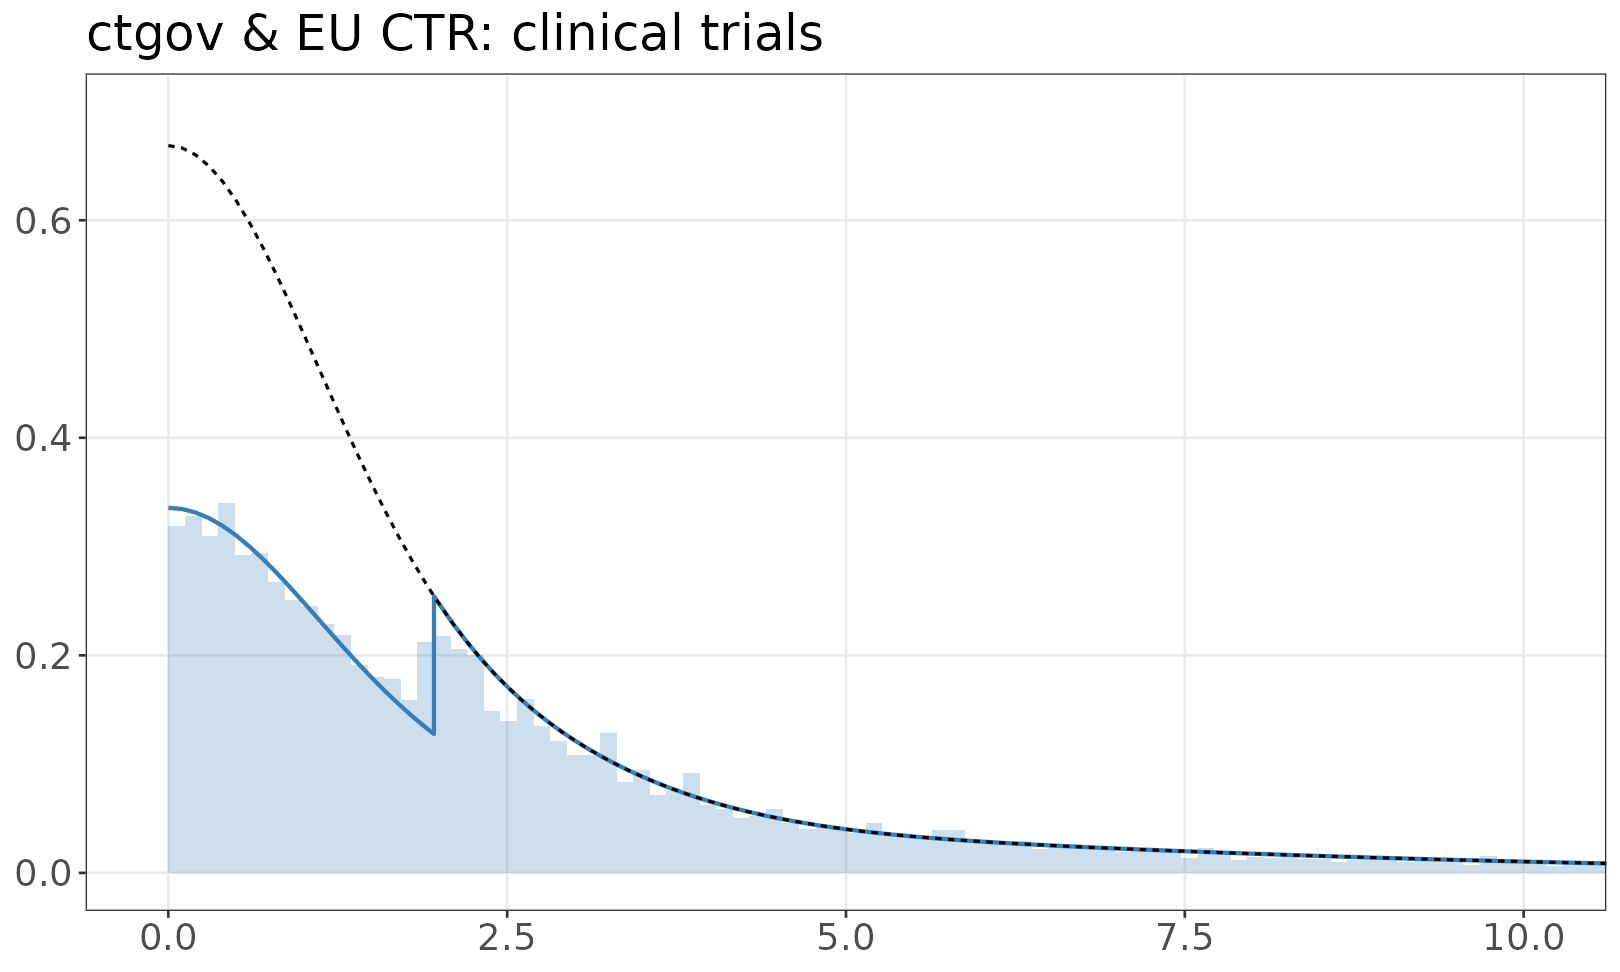
Model of z-values
BEAR fits a single model to ClinicalTrials.gov and EU CTR because the two clinical-trials registries have similar reporting structures and z-value derivations. The plot therefore shows the combined clinical-trials fit. The companion dataset page is EU Clinical Trials Register (EU CTR). The fitted mixture model is shown over the empirical distribution of absolute z-values. The solid line is a mixture of half-normals, with selection. The dashed line shows the distribution without selection. If there are inequalities (e.g. studies reporting p < 0.05) the histogram resamples values from the appropriate set.