Chavalarias et al. 2016 (PubMed/Medline)
To download only this data file: Chavalarias.rds (24 MB)
To download all BEAR datasets, click here.
Chavalarias et al. 2016 (PubMed/Medline)
Reference: Chavalarias et al. (2016).
Research question: reporting of p-values in the biomedical literature
Data collection: the authors used large-scale text mining of MEDLINE abstracts and PubMed full texts: 4.5mln p-values in 1.6mln MEDLINE abstracts; 3.4mln p-values in 385k PubMed full-text articles.
Data availability: the extracted p-value dataset is publicly available https://dataverse.harvard.edu/dataset.xhtml?persistentId=doi:10.7910/DVN/6FMTT3 (about 6GB of data) As per the hosting platform: this dataset is released under the Creative Commons Attribution-NonCommercial 4.0 International License.
Data processing: unsigned z-values were derived from p-values assuming two-sided tests. P-value truncation operators were processed by collapsing variants such as <<, <<<, <=, less than, and =< into <. We dropped 0.7% of rows where p-values did not have a “plain” format and 0.08% of rows where truncation could not be unambiguously classified. For the distributed version of BEAR 50,000 studies are selected at random, with one row per study, in order to keep the file size manageable.
Additional variables used: source indicator (abstract versus full text).
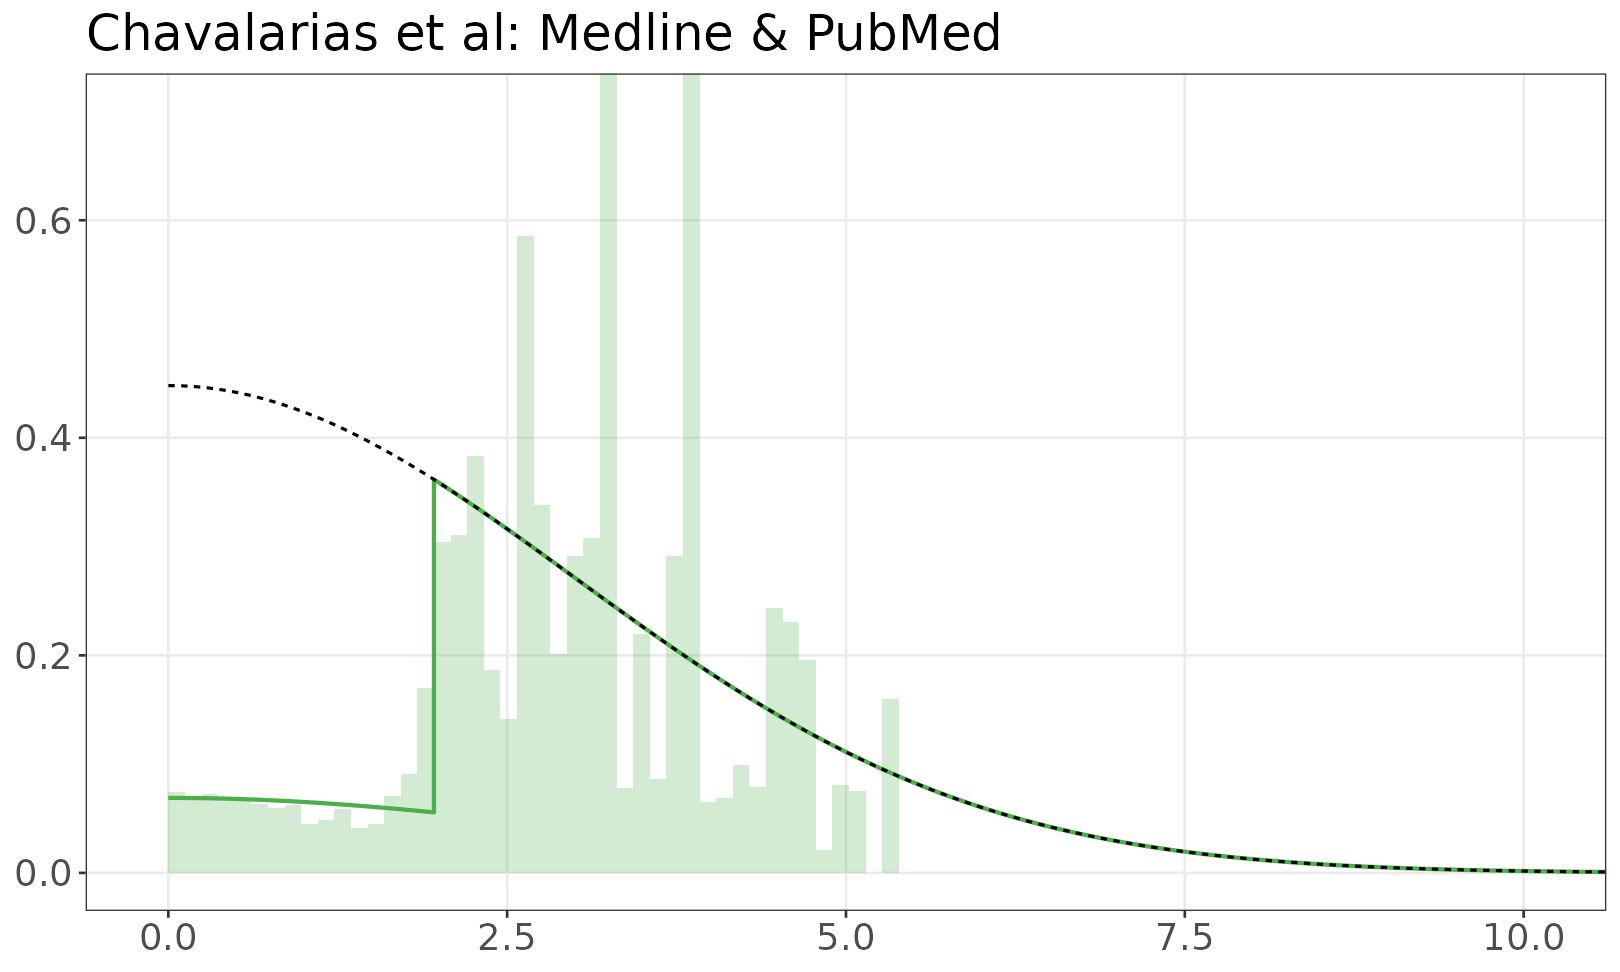
Model of z-values
The fitted mixture model is shown over the empirical distribution of absolute z-values. The solid line is a mixture of half-normals, with selection. The dashed line shows the distribution without selection. If there are inequalities (e.g. studies reporting p < 0.05) the histogram resamples values from the appropriate set.