EU Clinical Trials Register (EU CTR)
EU Clinical Trials Register (EU CTR)
Trials which reported results at the EU Clinical Trials Register, https://www.clinicaltrialsregister.eu/ (European Medicines Agency 2025).
Snapshot date: 18 January 2026
Data collection: we used R package ctrdata (Herold 2025) to create a snapshot of EU CTR (collection = "euctr"); we downloaded trial records with results only. We stored the downloaded records in a local SQLite database and extracted a fixed set of protocol and results fields plus several fields computed by ctrdata (trial phase, sample size, and a “first primary endpoint” p-value/size derived by the package). We only use the EUCTR portion of this extraction in BEAR.
Data availability: EUCTR is publicly accessible. The EUCTR legal notice notes that publication on EUCTR does not constitute an endorsement of the information reported.
Data processing: extensive. We use only primary endpoints. We default missing CI levels to 95% and where truncation of p-values was not stated we assume equality (the latter is the case for about 15% of data). Where data does not report whether a test is one- or two-sided, we assume two-sided. Rest of the derivation of z-values follows the
Standard procedure for dealing with p-values and confidence intervals. We set year to the entry date year since completion dates were unavailable. We dropped rows only when z was missing; infinite z-values are retained. We harmonise phase labels to follow the same naming convention as ClinicalTrials.gov.
Additional variables used: we retained phase labels and measure categorical variable (derived by us from the estimand label).
Model of z-values
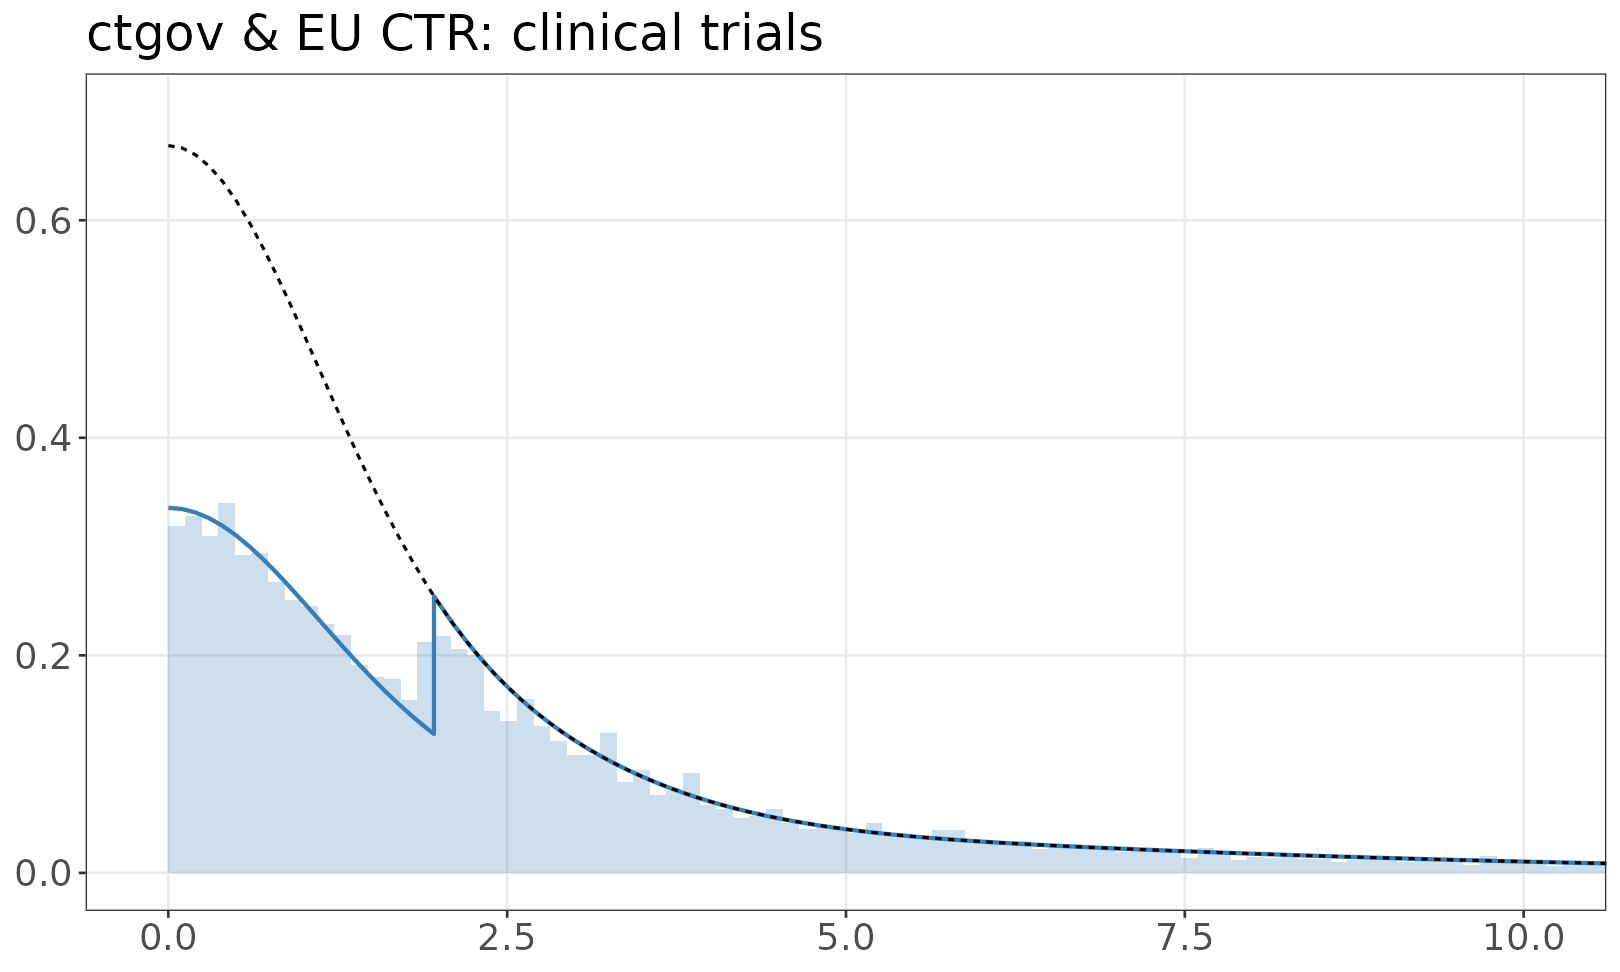
BEAR fits a single model to ClinicalTrials.gov and EU CTR because the two clinical-trials registries have similar reporting structures and z-value derivations. The plot therefore shows the combined clinical-trials fit. The companion dataset page is clinicaltrials.gov snapshot. The fitted mixture model is shown over the empirical distribution of absolute z-values. The solid line is a mixture of half-normals, with selection. The dashed line shows the distribution without selection. If there are inequalities (e.g. studies reporting p < 0.05) the histogram resamples values from the appropriate set.