Cochrane Database of Systematic Reviews (CDSR)
To download only this data file: Cochrane.rds (43 MB)
To download all BEAR datasets, click here.
Cochrane Database of Systematic Reviews (CDSR)
Trials with data available at CDSR, https://www.cochranelibrary.com/ (Cochrane Collaboration 2025)
Snapshot date: 20 November 2025
Data collection: using R package cochrane (Schwab 2024) we merged data from 8,726 records of reviews in CDSR and merged them into a single file cdsr_interventions_19nov2025.csv (63 MB).
Data processing: minimal processing with extensive filtering. Final BEAR effect sizes are recalculated for continuous outcomes as standardised mean differences and for dichotomous outcomes as probit-transformed effects. Only efficacy outcomes are retained. The distributed BEAR.rds file includes a smaller analysis subset with about 38,000 rows: the first comparison and first outcome from each review, restricted to efficacy outcomes. The processed data/Cochrane.rds file is larger and is available for users who want to make different selection decisions. It contains 760,486 result rows, representing 90,042 review-study pairs across 6,619 Cochrane reviews.
On processing side, we cleaned up study years, categorised measures (risk ratio, odds ratio, mean difference etc.) and experimental designs, especially an “RCT” flag (based on scanning of abstracts of each review for inclusion criteria). Most studies in CDSR are RCTs but some reviews also allowed quasi-experimental studies, which prevented us from categorising many studies. We also classify outcome rows into efficacy, safety, dropouts, and bias based on the comparison, outcome, and subgroup labels.
Unlike in most of the other datasets in BEAR, we filter CDSR data heavily. First, we only use the outcome and comparison of each review that are coded as “1”, as that is most likely the primary outcome and most relevant comparison. Secondly, we keep only rows classified as efficacy, excluding likely safety, dropout, and bias-related outcomes based on comparison, outcome, and subgroup labels. Thirdly, we only use studies with continuous and dichotomous outcomes, removing rows where effect estimates are based on instrumental variables or based on individual patient data. Lastly, we remove rows where measure of effect is unknown (retaining: OR, RR, Peto OR, mean difference, standardised mean difference, and risk difference) and rows where there are zero subjects.
Additional grouping variable: we retained a “source data type” variable to distinguish estimates from published, unpublished, “sought”, and mixed data sources. We also retain an outcome_group variable in the processed Cochrane data.
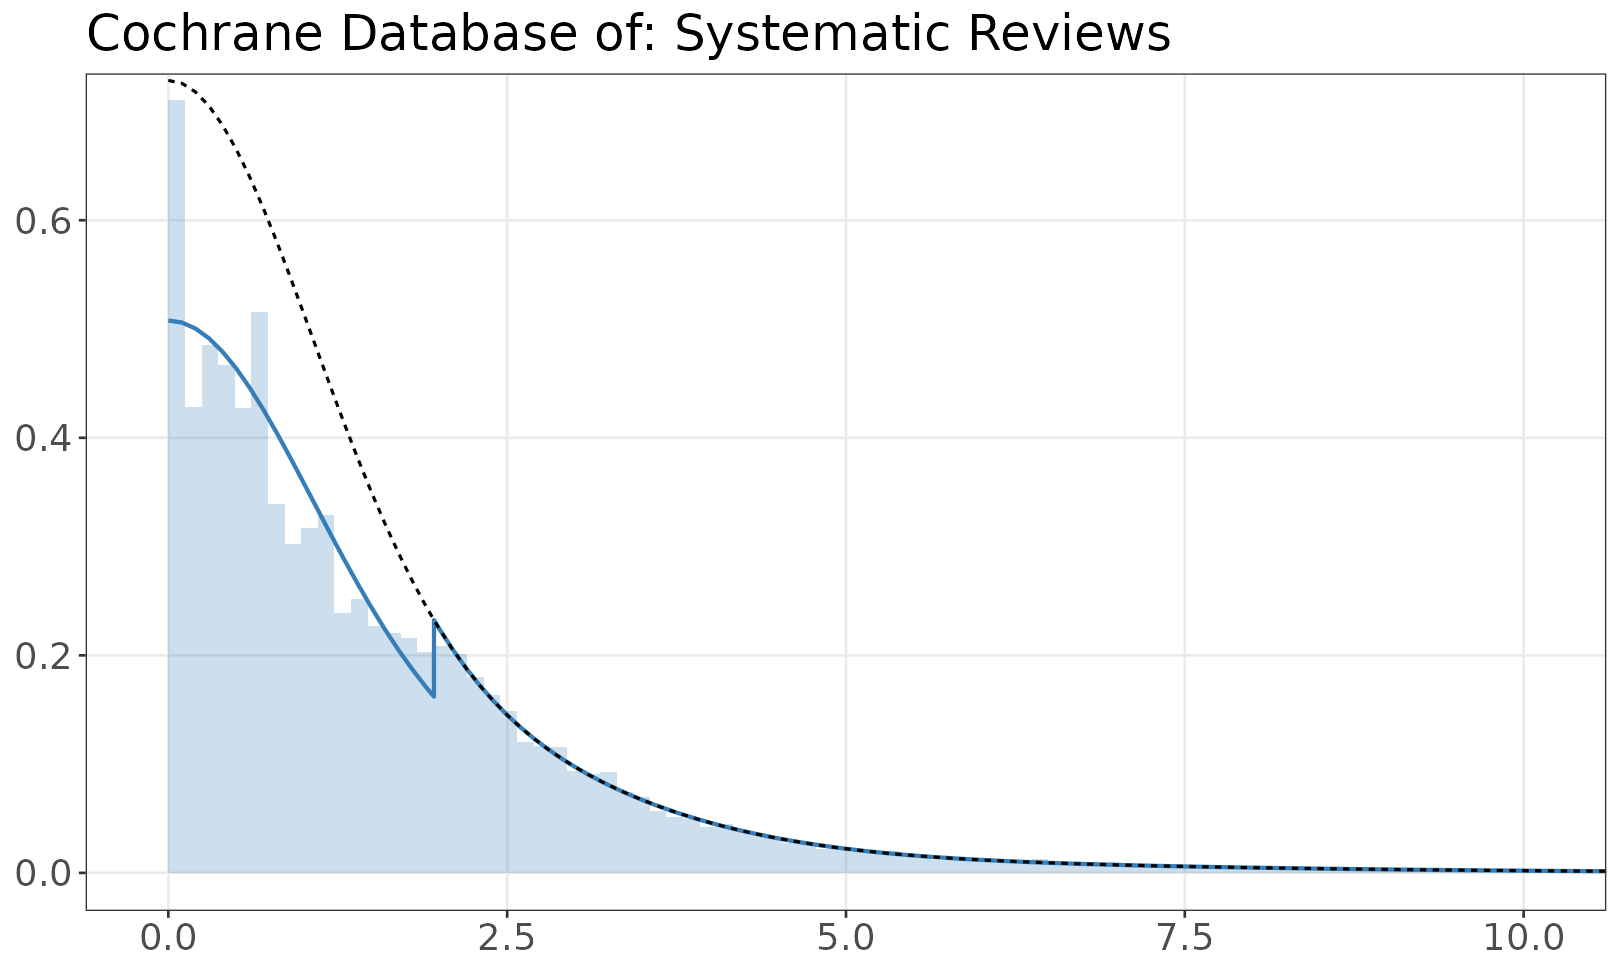
Model of z-values
The fitted mixture model is shown over the empirical distribution of absolute z-values. The solid line is a mixture of half-normals, with selection. The dashed line shows the distribution without selection. If there are inequalities (e.g. studies reporting p < 0.05) the histogram resamples values from the appropriate set.