Brodeur et al. 2024 (economics)
To download only this data file: Brodeur.rds (819 KB)
To download all BEAR datasets, click here.
Brodeur et al. 2024 (economics)
Reference: Brodeur et al. (2024).
Research question: are preregistration and pre-analysis plans associated with reduced p-hacking and publication bias in economics?
Data collection: manually extracted test statistics from articles identified as RCT studies in leading economics journals published 2018-2021. Extraction was performed table by table. They collected coefficients of interest from results tables, excluding constants, balance checks, robustness checks, regression controls, and placebo tests. Each source row corresponds to a single reported test statistic, linked to a paper-level identifier. Unlike most other sources in BEAR, this means the source data have dozens of estimates per paper. The paper reports 314 articles and 15,992 test statistics; the shared merged.dta file contains 16,390 estimates, of which 15,917 are RCT rows retained here. The paper-level preregistration coding matches the source article counts: 83 preregistered articles, including 44 with a pre-analysis plan and 39 without one.
Data availability: replication data file merged.dta may be downloaded from https://dataverse.harvard.edu/file.xhtml?fileId=7884702&version=1.0
Data processing: the authors’ reported z-statistics were used directly and the reported coefficients and standard errors were retained. The source zstat field stores unsigned magnitudes, so we apply the sign of the reported coefficient when available. We retain RCT rows and use the source zstat field because the alternative myz field is not populated for all publication years in the replication file. We also retain a grouping variable distinguishing not preregistered studies, preregistered studies without a PAP, and preregistered studies with a PAP.
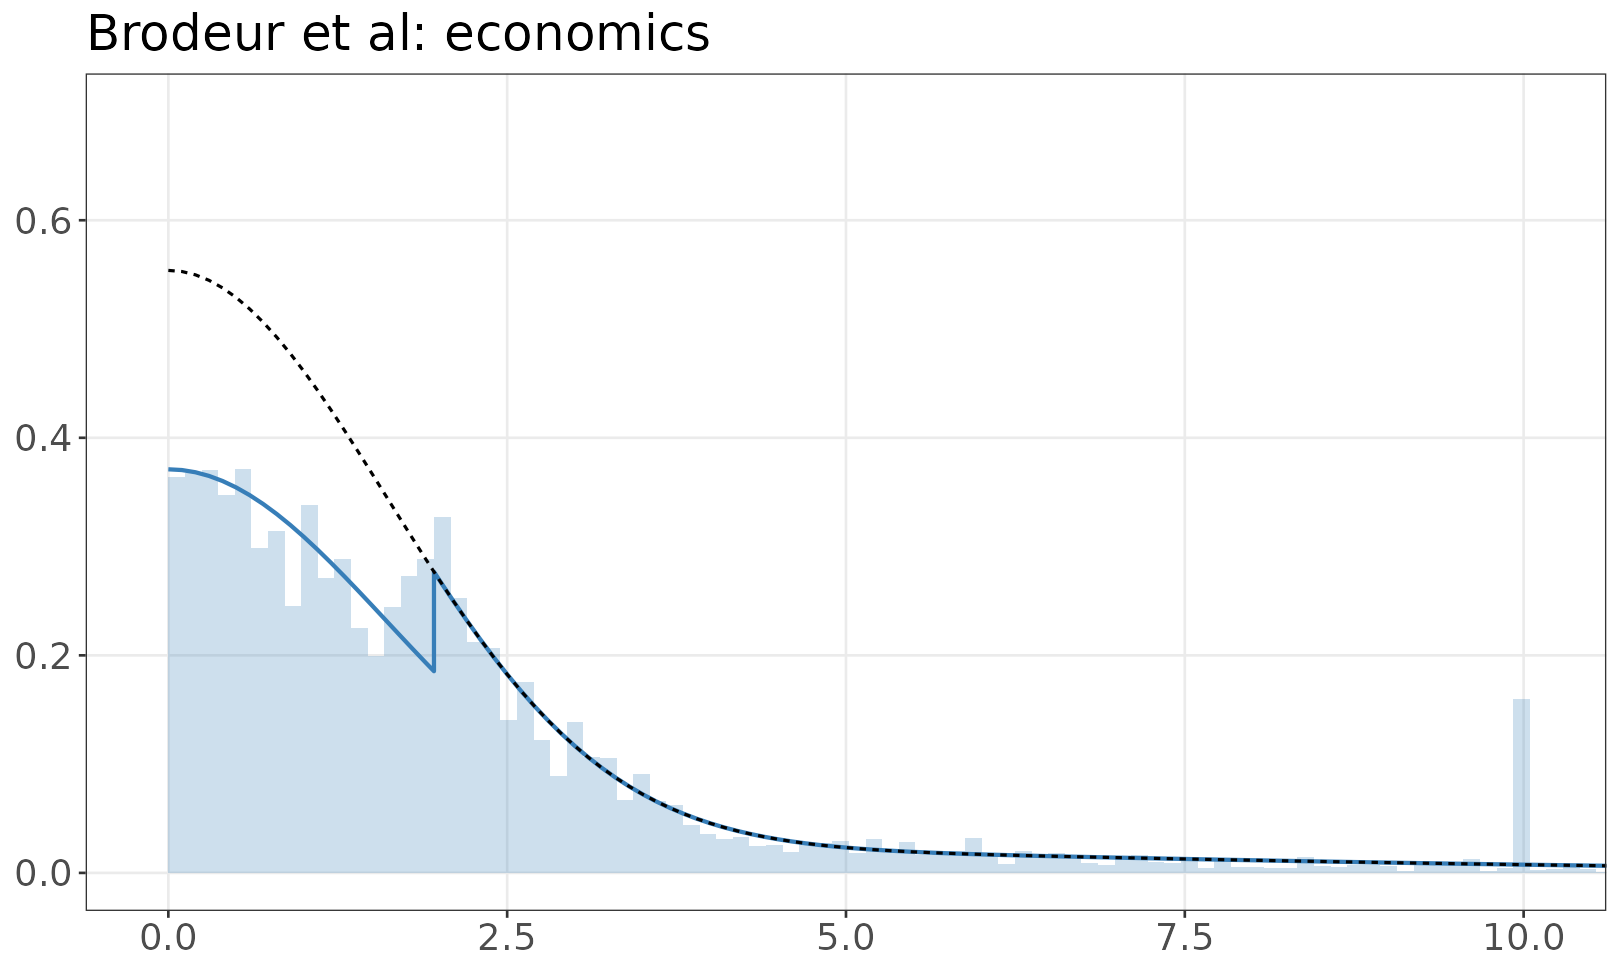
Model of z-values
The fitted mixture model is shown over the empirical distribution of absolute z-values. The solid line is a mixture of half-normals, with selection. The dashed line shows the distribution without selection. If there are inequalities (e.g. studies reporting p < 0.05) the histogram resamples values from the appropriate set.