Barnett and Wren 2019 (PubMed/Medline)
To download only this data file: BarnettWren.rds (16 MB)
To download all BEAR datasets, click here.
Barnett and Wren 2019 (PubMed/Medline)
Reference: Barnett and Wren (2019).
Research question: Bias for statistical significance in health and medical journals
Data availability: The dataset Georgescu.Wren.RData may be downloaded from https://github.com/agbarnett/intervals/tree/master/data and also https://github.com/jdwren/ASEC. Data file is Georgescu.Wren.RData. Availability: no clear licence given in the repo but the article is CC BY 4.0 in BMJ Open.
Data description and source: The dataset is a collection of confidence intervals for ratio estimates from Medline papers from 1976-2019. Authors scraped (via regular expressions, followed by an independent check using another data mining algorithm, manual checks for 10,000 intervals) 968,000 CIs from abstracts and 350,000 from full texts.
Notes: These are “ratio estimates” like odds ratios, hazard ratios and risk ratios. Note that binary outcomes tend to have (much) lower information than continuous outcomes.
Data processing: We excluded a small fraction of data. First we restricted to 95% confidence intervals only: where ci.level was missing we assumed it was 0.95; among intervals with a known ci.level, about 0.3% were not 95% and were dropped. We dropped intervals with non-positive width (i.e. lower >= upper). We used log scale (we replaced zero or negative lower bounds with a small positive constant; this affected about 0.1% of the sample) and backed out an approximate standard error and point estimate under the usual normal approximation for a 95% CI, setting point estimate to half-point of the interval.
For the distributed version of BEAR 50,000 studies are selected at random, with one row per study, in order to keep the file size manageable.
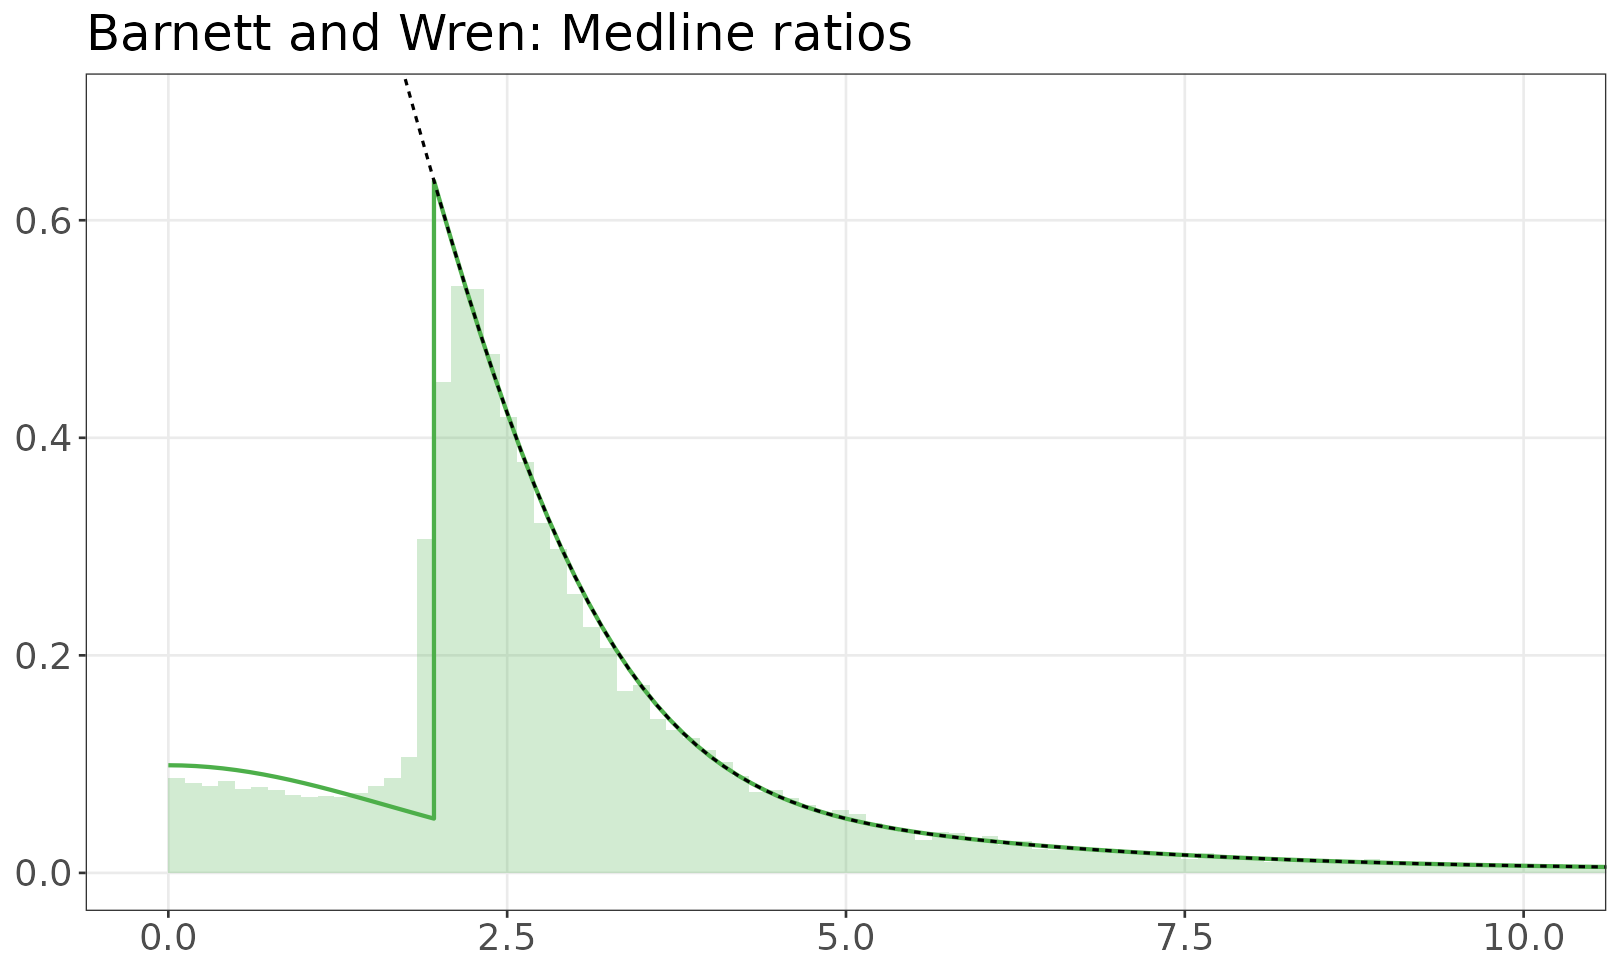
Model of z-values
The fitted mixture model is shown over the empirical distribution of absolute z-values. The solid line is a mixture of half-normals, with selection. The dashed line shows the distribution without selection. If there are inequalities (e.g. studies reporting p < 0.05) the histogram resamples values from the appropriate set.