Lang 2025 (economics)
Lang 2025 (economics)
Reference: Lang (2025).
Research question: how frequently are statistically significant rejections of nulls in economics false positives?
Data collection: This paper uses empirical top-five economics papers published in 2021 and the Brodeur, Cook, and Heyes dataset of 2015 and 2018 articles in 25 leading economics journals. In each paper, research assistants checked abstracts and results text, kept estimates emphasized in abstracts or as principal results, used the authors’ preferred specification when several specifications tested the same hypothesis, and excluded robustness checks or heterogeneity analyses unless heterogeneity was central to the article.
The source data contain 3,885 extracted hypothesis tests from 736 papers. The main sample in the Lang paper is the subset of 2,082 tests with 1.96 <= |t| < 10. The paper also reports one null per article: 736 t-values, but without row or paper identifiers. We do not use the latter.
Data processing: We use the full 3,885-test source table. We use supplied t-statistics (derounded by Lang) as the z value and compute two-sided p-values from |z|. We add source-article DOIs based on bibliographic metadata matching, and the reported or derounded coefficients and standard errors. The one-null-per-article t-vector is not represented in the row-level BEAR data because its source file has no identifiers that would support matching to the extracted-test table.
Notes: Presumably there is a strong overlap with Brodeur in terms of selected papers, but with differences in extracted values.
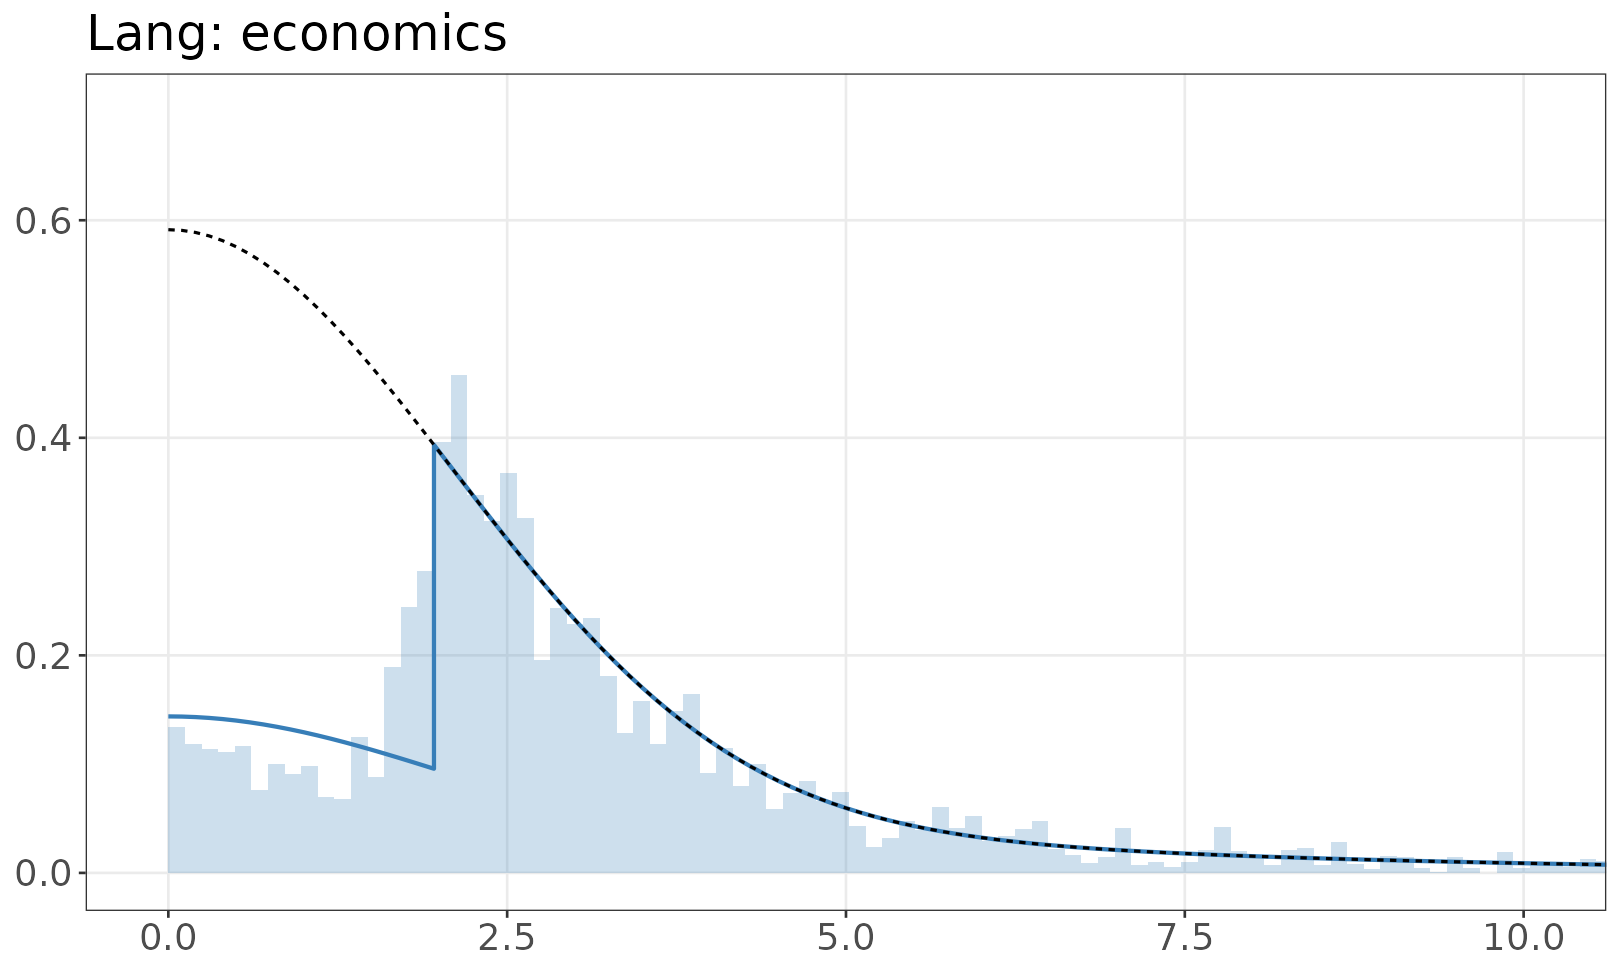
Model of z-values
The fitted mixture model is shown over the empirical distribution of absolute z-values. The solid line is a mixture of half-normals, with selection. The dashed line shows the distribution without selection. If there are inequalities (e.g. studies reporting p < 0.05) the histogram resamples values from the appropriate set.