Askarov et al 2023 (economics)
To download only this data file: Askarov.rds (1.2 MB)
To download all BEAR datasets, click here.
Askarov et al 2023 (economics)
Reference: Askarov et al. (2023).
Research question: Impact of mandatory data sharing on (excessive) statistical significance in economics papers
Data availability: file Mandatory data-sharing 30 Aug 2022.dta may be downloaded from https://github.com/anthonydouc/Datasharing/blob/master/Stata/; reproducibility package at https://dataverse.harvard.edu/file.xhtml?fileId=7884702&version=1.0
Data description and source: The paper includes 64,000 economic estimates surveyed by Ioannidis et al. (2017) plus results of “searching through numerous databases, journal websites, and also an email survey of 109 authors known to have produced meta-analyses of economic topics. We cast the widest net possible to capture empirical economic estimates. Thus, some of the papers included in these meta-analyses were originally published in political science and psychology journals. Nevertheless, these meta-studies deal with economics topics.” Later they note: “we collect 166,924 parameter estimates from 345 distinct research areas, of which 20,121 were published in 24 of the leading general interest and field journals” The paper mentions 12,521 observations before and 2,537 after data sharing policies in 24 journals; reproducibility dataset has 32 journals (authors removed some smaller ones) and 22,172 rows. The rows are meta-analysis estimate rows, not all results from each paper: the meta-analyses collect comparable effect sizes for specific economic phenomena and are not used only to identify papers for full extraction.
Notes: Askarov et al article starts from the Ioannidis-Stanley-Doucouliagos dataset, same as in the case of Arel-Bundock et al (another dataset in BEAR). Both datasets incorporate additional data and target different fields of research, but there is likely a lot of overlap between the two sets.
Data processing: We use the same source file Mandatory data-sharing 30 Aug 2022.dta (11.6 MB) as in the reproducibility package. Signed z-values were computed as reported effect sizes divided by their standard errors.
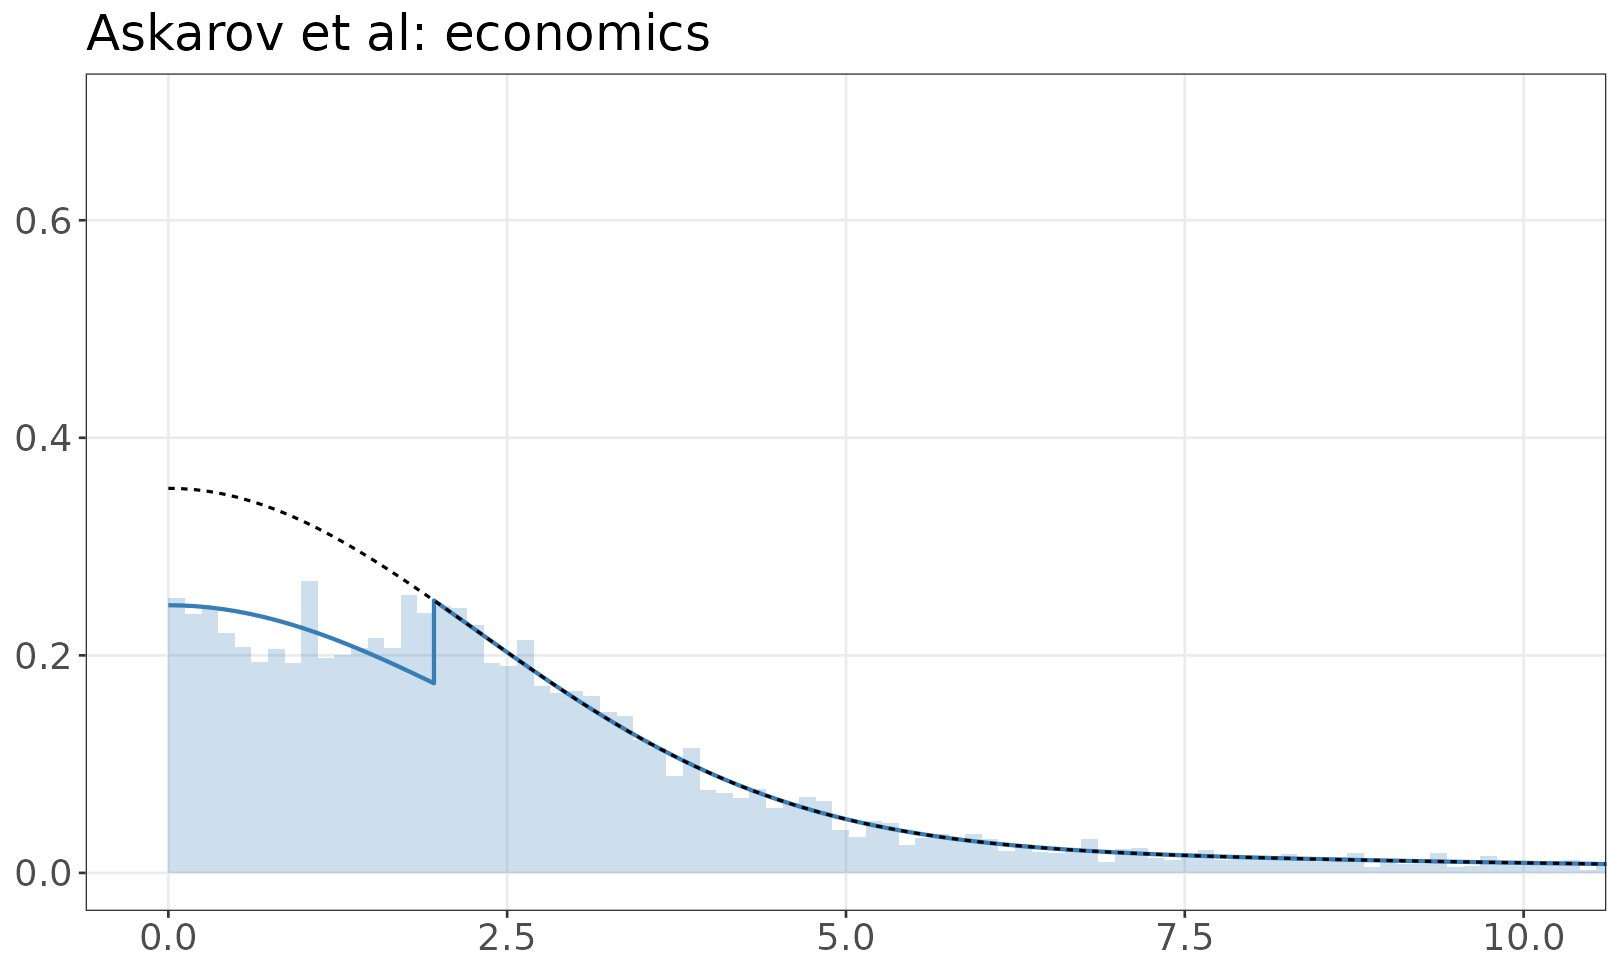
Model of z-values
The fitted mixture model is shown over the empirical distribution of absolute z-values. The solid line is a mixture of half-normals, with selection. The dashed line shows the distribution without selection. If there are inequalities (e.g. studies reporting p < 0.05) the histogram resamples values from the appropriate set.