SCORE (social science)
Reference: Tyner et al. (2026).
Research question: investigating the replicability of published claims in the social and behavioural sciences.
Data availability: the SCORE replication package is available at https://osf.io/g5sny/. The package includes replication data as well as reviews of claims made in included papers.
Data description and source: BEAR includes two SCORE outputs. The replications source dataset has 548 rows: 274 original claims and 274 matched replications. After BEAR processing and filtering, 267 matched replication rows are retained. The “all claims” source dataset has 3,066 claim-level rows from the set of replicated papers (but no replications of these claims), where we select one statistic per claim; after BEAR processing and filtering, 1,946 claim rows are retained.
Data processing: For the matched replication output, we used the package’s converted correlation scale where available for original and replication statistics. For the all-claims set, effects are heterogeneous across the source papers.
When several inputs are available for z-value construction in the all-claims dataset, we prefer reported z, then reported t, then coefficient divided by standard error, then signed square-root F for numerator df 1, then a 95% confidence interval with a point estimate, then a two-sided p-value conversion. When the selected statistic only supplies a p-value and no sign can be inferred, the z-value is unsigned. For the all-claims text, it is typical to have multiple statistics backing up a single claim, e.g. “F(1,38) = 3.73, p = .033, partial eta-squared = .16; F(1,39) = 7.28, p = .010, partial eta-squared = .16; F<1”. We created a rule to pick one statistic per claim using agreement with the SCORE significant/nonsignificant coding, statistic provenance, exactness, available effect and standard error, and text order.
Additional grouping variables: discipline and SCORE source indicator.
Model of z-values
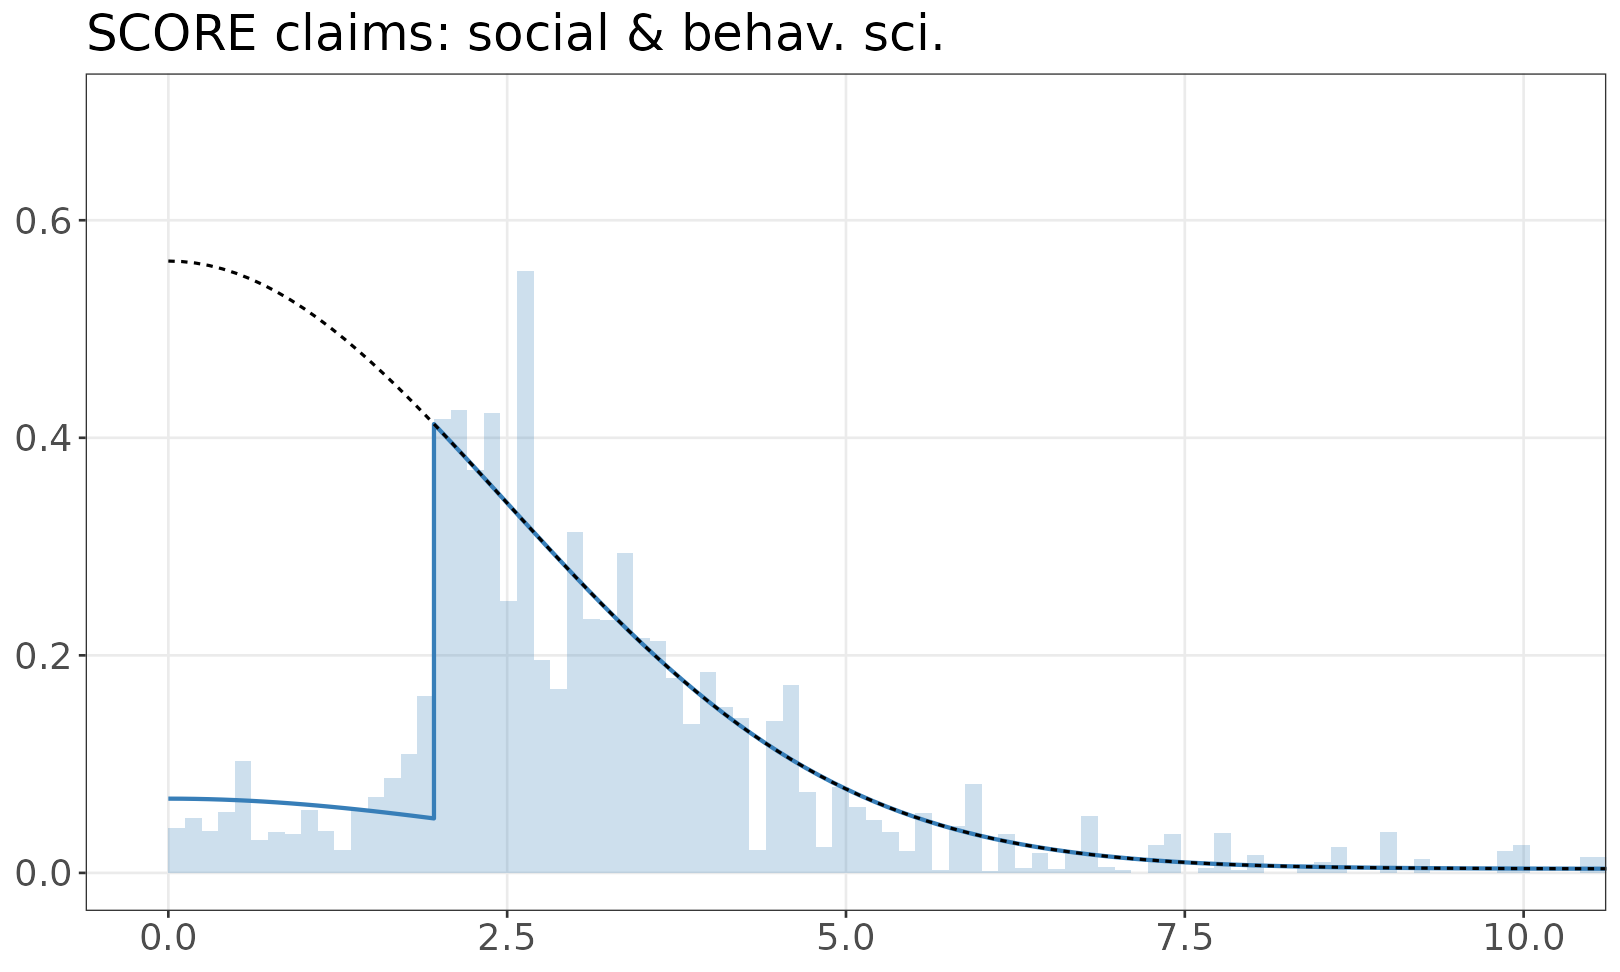
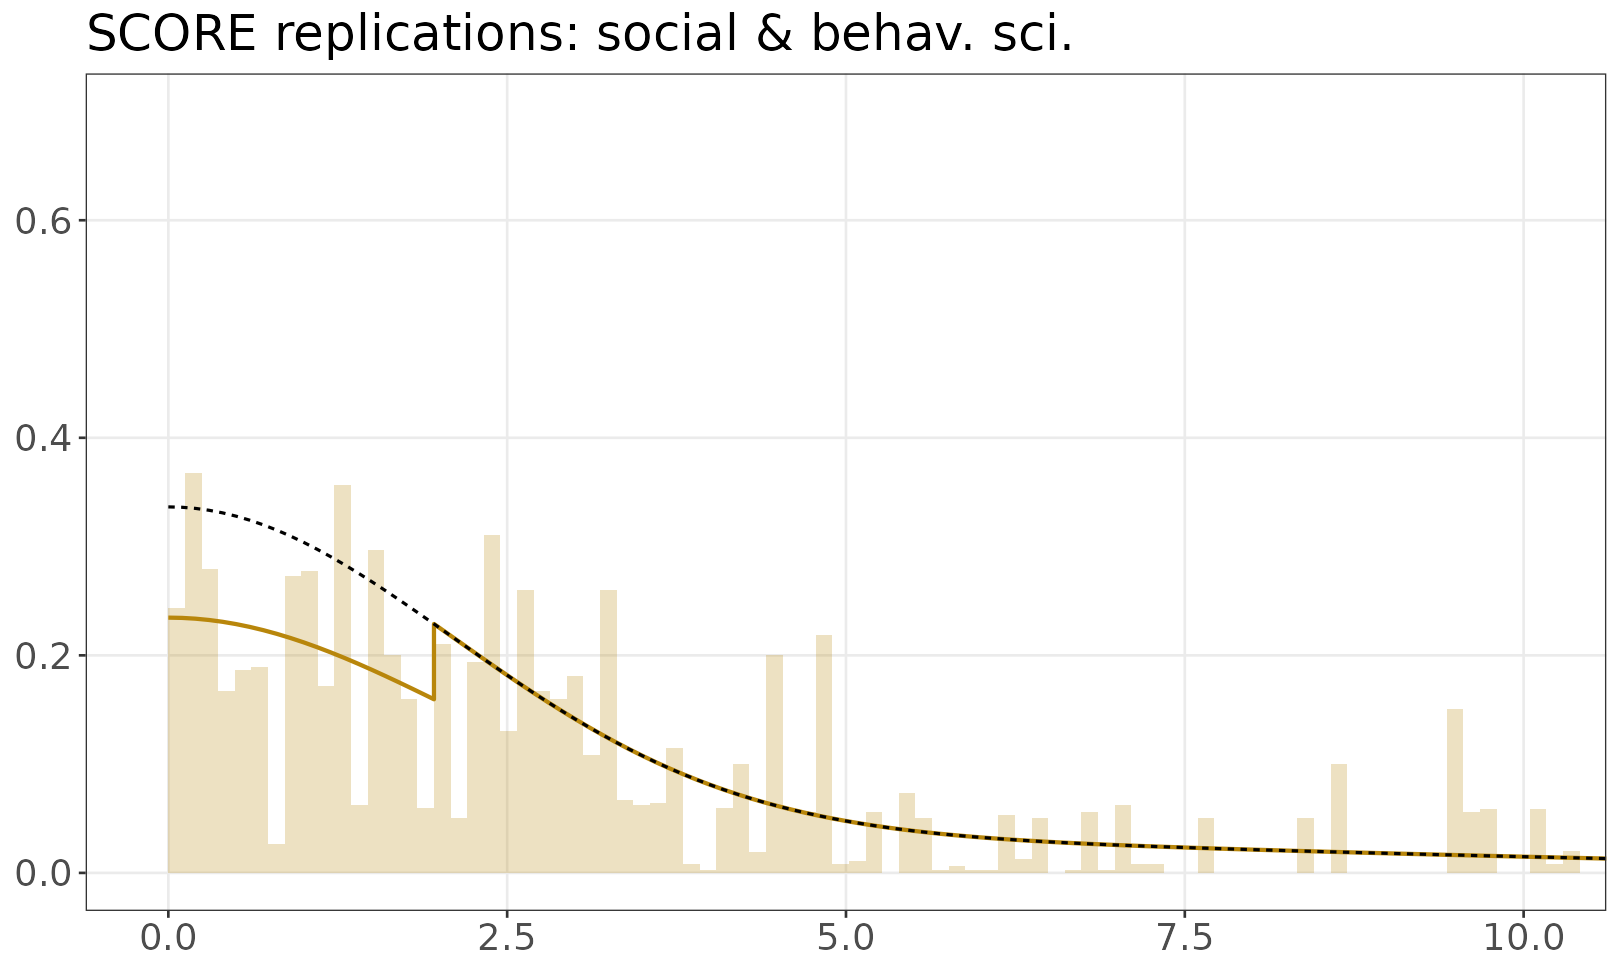
This documentation page covers more than one fitted dataset, so the fitted models are shown separately. The fitted mixture model is shown over the empirical distribution of absolute z-values. The solid line is a mixture of half-normals, with selection. The dashed line shows the distribution without selection. If there are inequalities (e.g. studies reporting p < 0.05) the histogram resamples values from the appropriate set.
SCORE claims: social & behav. sci.
SCORE replications: social & behav. sci.
References
Tyner, Andrew H., Anna Lou Abatayo, Mason Daley, et al. 2026.
“Investigating the Replicability of the Social and Behavioural Sciences.” Nature 652: 143–50.
https://doi.org/10.1038/s41586-025-10078-y.